The presentations during the FDA-AACR Liquid Biopsies in Oncology Drug and Device Development Workshop on July 19, 2016 included several important pieces of information that will likely guide the development of assays and their review by the FDA.
First, several presenters indicated that on different platforms circulating cell free DNA (ccfDNA) can be used to detect mutations in cancer in about 80% of patients. This is important as far as sensitivity is concerned and suggests that circulating tumor DNA-based liquid biopsies cannot replace invasive biopsies entirely. This could be due to a combination of both the biology of cancer and the sensitivity (already very high) of current technology. However, it also suggests that 80% of the time, important information can be obtained from this approach. At an earlier FDA Workshop on Companion Diagnostics on March 24, 2015, it was mentioned that the material obtained from invasive biopsies is often very limited, which puts constraints on how pathologists can analyze that material. Thus, while it is generally not possible to analyze a needle biopsy using multiple different NGS-based assays, this constraint is not present with liquid biopsies.
Second, several presenters from entities that perform liquid biopsies indicated that median circulating tumor DNA (ctDNA) may be less than 1% of ccfDNA. For late stage cancers, there are numerous reports in the published literature and elsewhere of high amounts of ctDNA in the blood. However, when testing patients who have just been diagnosed with cancer in earlier stages of disease, it appears that the amounts of ctDNA are often much lower. This will likely require that ccfDNA-based tests use relatively large amounts of input material (i.e., much more than the 10 ng that is typical of Thermo Fisher Scientific Ion Torrent AmpliSeq-based assays) and that a very high depth of coverage be obtained for a given target. The FDA has been concerned with the validation of NGS-based tests that may look at hundreds of targets. Given that 5,000-fold – if not higher – coverage may be needed when assessing ctDNA, the costs associated with obtaining that coverage may entice assay developers to limit the number of analyzed regions to those that are most likely to yield an actionable result. This also makes validation a bit more straightforward and provides insight into what kinds of reference materials will be required.
Expected Performance of Circulating Cell-free DNA Tests
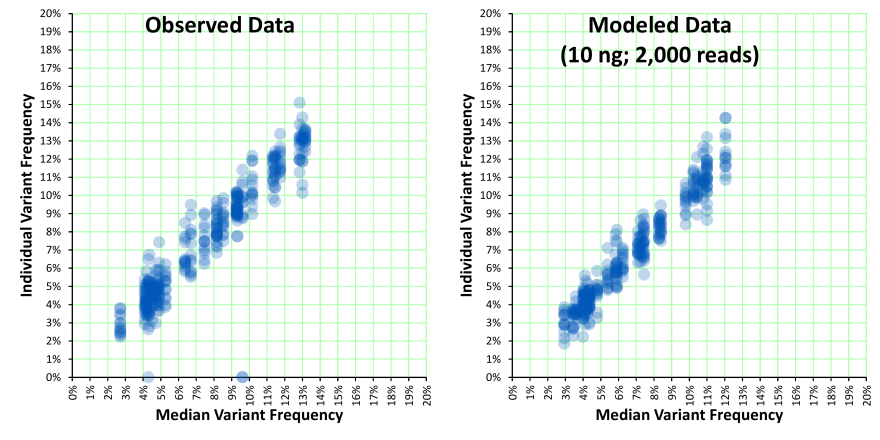
The rest of this article will be focused on describing the expected performance of ccfDNA-based tests and providing some equations that you can use. As a leading provider of reference materials, SeraCare has received quite a bit of feedback on how our materials perform. Interestingly, unexpected performance is often not so unexpected when one takes into account the statistical differences between routine clinical chemistry assays and NGS-based assays where there is a very limited amount of a given analyte. For example, with the 10 ng of input DNA and the 2,000 reads that are typical of an Ion Torrent AmpliSeq assay, the observed variance of variant frequencies may appear to be high (i.e., R² is not 0.99), but it may be as expected when taking into account the amount of input material and sequencing depth. With limited amounts of analyte, Poisson and Binomial distributions become relevant.

The Poisson and Binomial Distributions
The Poisson distribution can be used to describe the likelihood of obtaining a certain number of molecules when a certain average number of molecules is expected. The standard deviation (SD) is the square root of the average number of molecules. The CV is 1 over the standard deviation. One mL of a 1 nanomolar glucose solution contains about 600 billion molecules of glucose. When 1 mL aliquots are prepared, each aliquot will still be 1 nanomolar and will contain a similar number of glucose molecules (subject to the precision of aliquoting 1 mL) because the CV is negligible. On the other hand, when a mL of a solution averages 1 molecule of DNA, it is not unlikely that, when 1 ml aliquots are prepared, some will not contain any molecule of DNA. In the 1 molecule example, approximately 37% of 1 mL aliquots will not contain any molecules of DNA and approximately 8% will contain more than 2. In Excel, this can be calculated using =POISSON.DIST(0,1,FALSE) and =1-POISSON.DIST(2,1,TRUE). The fact that the SD and CV are tied to the average number of molecules is highly relevant to assays that detect rare molecules, such as those that analyze ctDNA. The Poisson distribution also enables digital PCR (for more details about the statistics involved with digital PCR, here is a PDF of a US National Institute of Standards and Technology presentation).
The Binomial distribution can be used to describe the likelihood of observing a certain outcome a certain number of times in a certain number of tries when the likelihood of that outcome is known. Similar to the Poisson distribution, the SD is influenced by the square root of the number of tries but is also influenced by the likelihood of observing the outcome. The CV increases substantially as the likelihood decreases. Thus, if one prepares 10 aliquots of 1 mL each (and assuming that the starting volume is very large), there is a ~17% likelihood that exactly half of those aliquots will not contain any molecules of DNA. This can be calculated using =BINOM.DIST(5,10,POISSON.DIST(0,1,FALSE),FALSE). The Binomial distribution can be used to calculate confidence intervals for digital PCR.
Applying the Distributions to Circulating Tumor DNA (ctDNA)
One mL of plasma contains about 5 ng of ccfDNA. With 3.5 pg per haploid genome, there are about 1,429 haploid genomes represented in those 5 ng. Using =BINOM.INV(100000,1429/100000,0.025) and =BINOM.INV(100000,1429/100000,0.975), it possible to determine that ~95% of the genome should have between 1,355 and 1,503-fold coverage (assuming that the genome is represented evenly in ccfDNA – which may not be the case based on a data from Resolution Bioscience at the workshop).
However, ctDNA may only be present at 0.1%, and resistance mutations like T790M may be present at even lower levels. Using =BINOM.INV(100000,1.429/100000,0.025) and =BINOM.INV(100000,1.429/100000,0.975) reveals that ~95% of somatic variants at 0.1% are only expected have between 0 and 4-fold coverage. In fact, using =POISSON.DIST(0,1.429,FALSE) reveals that 24% of somatic variants at 0.1% would not be present in a 5 ng sample. For an assay where duplicate molecules can be identified (e.g., through use of molecular barcodes) and where at least 5 separate unique starting molecules are needed in order to detect a variant, =POISSON.DIST(4,1.429,TRUE) reveals that 98.5% of (i.e., nearly all) somatic variants would not reach the 5 unique molecule threshold.
Therefore, more input material is needed. With 50 ng (typical of a 10 mL blood sample), ~95% of 0.1% somatic variants are expected to be present at between 7 and 22 copies. The likelihood of 0 copies is only 0.0001%. The likelihood of fewer than 5 copies is only 0.15%. Overall, using a sufficient amount of input material is essential.
One must also keep in mind that not all input material may be analyzable. Given that ccfDNA has an average length of ~170 bp, an amplicon-based assay may not be able to analyze all input material when a critical primer binding site is missing on some molecules. With 100 bp amplicons, a quarter of input material may not be analyzable. With 150 bp amplicons, less than 20% of input material may be analyzable. For example, the T790M-containing exon of EGFR is 186 bases in length and could be sequenced with one large amplicon; however, that would be far from optimal when ccfDNA is the input. Overall, a transition to shorter amplicons is expected to increase an assay’s ability to detect low frequency variants. At the same time, that could also reduce the number of different bases that are sequenced unless additional amplicons are added back.
Hybrid/capture-based assays are also limited because it may not be possible to convert all input material into an amplifiable and analyzable form. With sonicated DNA, efficiencies between 5 and 20% have been reported (reference 1). With ccfDNA, higher efficiencies are expected, but may still fall well below 100% due to constraints imposed by the reactions (e.g., extended ligation times may cause unwanted ligation products). With 50% efficiency and 50 ng of input, the likelihood of fewer than 5 copies for a 0.1% variant rises from 0.15% to 16%.
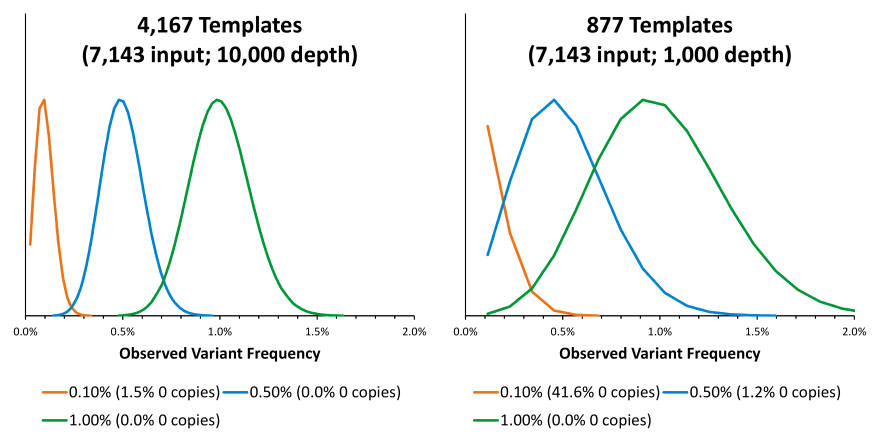
Sufficient sequencing depth is also critical. For an NGS assay that includes an amplification step that makes it possible for an input molecule to be sequenced twice (which is the vast majority of NGS assays), the amount of material for which data is generated will likely be less than the total amount of input material. With 50% efficiency and 50 ng of ccfDNA input, there are ~7,143 templates per target, of which ~0.1% would be mutant. Sequencing this to a depth of 10,000 would result in some reads coming from the same templates (duplicates) and some templates not being sequenced. The net effect is that the assay would behave like one with ~4,167 templates and the likelihood of observing fewer than 5 unique copies would rise to nearly 60%. A solution is to sequence to a depth above 10,000 and/or to use even more input material. One could allow fewer unique reads; however, that would reduce the assay’s robustness in the presence of sequencing errors (as well as the potential to detect residual laboratory contamination).
Performance Metrics
As mentioned previously, the SD and CV are dependent on the amount of material being analyzed. For an assay that uses 50 ng of ccfDNA as input, and can analyze 50% of that input and sequences to a depth of 10,000, a variant at 0.1% would be measured with an SD of ~0.05% and a CV of ~49%. Additionally, 95% of observed 0.1% variant frequencies would range from 0.02% to 0.22%. The SD can be calculated with =SQRT(0.001)*SQRT(1-0.001)/SQRT(4167) and the CV can be calculated with =SQRT(1-0.001)/(SQRT(0.001)*SQRT(4167)). The observed variant frequency ranges are calculated with =BINOM.INV(4167,0.001,0.025) and =BINOM.INV(4167,0.001,0.975). Lowering the depth from 10,000 to 1,000 would not be recommended because the assay would be performing as if there were ~877 templates instead of ~4,167 templates and the distributions of observed variant frequencies would be broader.

It should be emphasized that these performance metrics are due to the constraints imposed by the material being analyzed and the nature of the assay. In practice, the observed performance may be even worse due to additional sources of variance that are introduced by the assay.
Finally, using reference material that contains many variants at a similar frequency, it is possible to assess the sensitivity of an assay based on the Poisson distribution. The detectable copies in the sample are simply the natural logarithm of 1 divided by the fraction of missed variants. For example, if 20% of variants are missed, then there are about 1.6 detectable copies of each variant in the material. If, based on its specifications, the amount of reference material should contain 5 copies, then that would indicate that about 32% of the input material is analyzable by the assay.
If you are interested in learning about SeraCare’s Circulating Tumor DNA Reference Materials as well as our other oncology-related products, more information is available here.
References:
- Aigrain L, Gu Y, Quail MA. Quantitation of next generation sequencing library preparation protocol efficiencies using droplet digital PCR assays - a systematic comparison of DNA library preparation kits for Illumina sequencing. BMC Genomics. 2016 17(1):458. doi: 10.1186/s12864-016-2757-4. PubMed PMID: 27297323


